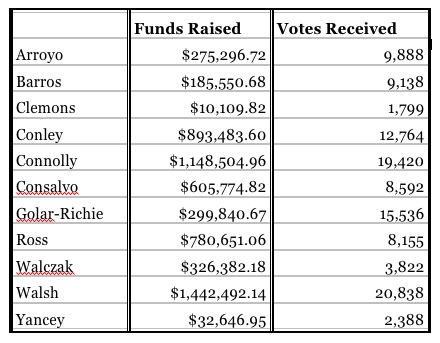
Which Mayoral Candidates Got the Most Bang for Their Buck?
Here’s an interesting measure of mayoral campaign performance: Who got the most votes for every dollar raised? As the chart below shows, the African-American candidates, by and large, outperformed their lackluster fundraising to get the most bang for their buck.
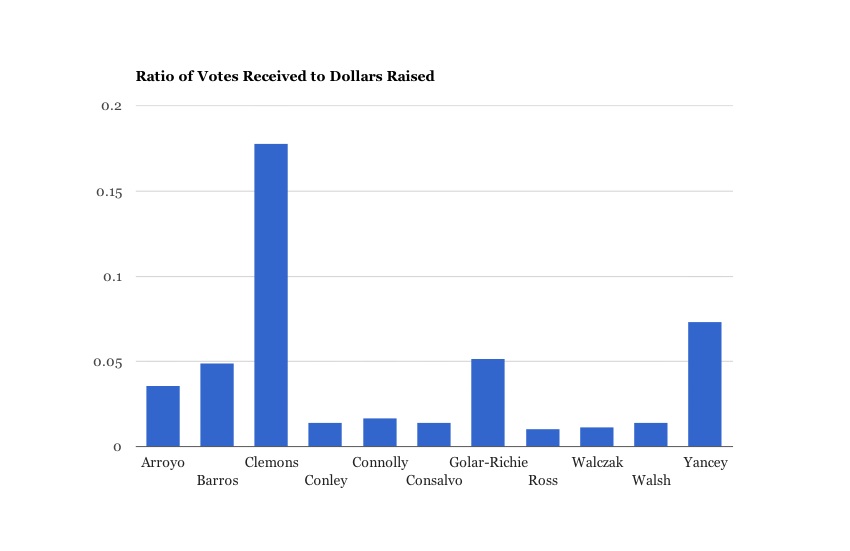 We divided the unofficial number of votes each candidate received by the number of dollars they raised from January 1st to September 15. (That’s the last date for which the state’s Office of Campaign & Political Finance has data on its site.) You can see the results above.
The most financially efficient campaigns were headed by Clemons, Yancey, Charlotte Golar-Richie, and John Barros. Those are, coincidentally, the four leading African-American contenders in the race. The losers were Dan Conley and Mike Ross. The data underscores the idea that minority communities with less campaign organization and fundraising networks weren’t able to overcome their early disadvantages in the relatively brief campaign. The Boston Globe’s Jim O’Sullivan noted this as he broke down reasons that the majority-minority city had voted two Irish white guys to their mayoral final:
Weighing his health problems against his desire to continue governing the city, the mayor waited until late March before making his intentions known. That compressed the election cycle, which played to the advantage of established political figures with existing political organizations and campaign accounts that already showed hardy balances.
As an aside, we excluded David James Wyatt from the chart because he raised about $50 and managed to get over 300 votes, which puts him so far ahead as to mess up our nice little chart. Charles Clemons and Charles Yancey, we should add, benefit from being on the low end of the fundraising and vote-getting spectrum, too, but not nearly so much. Still, their performances aren’t as impressive as that of Golar-Richie, who came in third behind the two winners, despite a huge fundraising gap.
On that note, the other takeaway is just how little this chart reflects the actual election results, where the only thing that matters is who finishes first and second, not the amount of money one spends to get there. John Connolly and Marty Walsh performed terribly in terms of votes received to dollars spent. But they did raise the most money, and in the end, they won the most votes, too. This data shows which campaigns managed to find traction with voters despite a fundraising disadvantage. But, to state the obvious, you’re much better off just not having that fundraising disadvantage in the first place.