Do You Live in One of the Healthiest Housing Markets in Massachusetts?

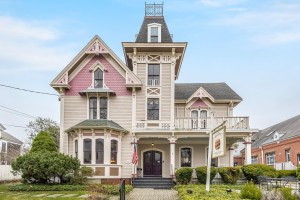
Milton, Mass. photo by Eric Moreno on Flickr/Creative Commons
Believe it or not, there are folks living not too far outside of Boston who don’t have back-breaking mortgages. A new study says some of the healthiest and most stable housing markets in Massachusetts are only a few miles from the city.
In its annual ranking of the healthiest housing markets in the country, financial technology company SmartAsset identified the top ten healthiest markets across Massachusetts. The list, as it turns out, consists solely of towns and cities in the eastern part of the state.
By looking at factors like the average number of years residents live in their homes, the number of homes decreasing in value, the average number of days homes are on the market, and a few other affordability and stability metrics, SmartAsset assigned towns a healthy market index.
The healthiest market of all, Wilmington, scored an index of 91.19. The unassuming town north of Boston boasts a population that spends an average of 20.4 years in their homes. In Wilmington, houses stay on the market for about 41 days, and usually cost around 22 percent of a buyer’s income.
Nearby Woburn clocked in at second place, earning a healthy index score of 84.14. Residents spend an average of 17 years in their homes in Woburn, and houses tend to stay on the market there for an average of 25 days.
Some of the healthiest markets nearest Boston include Needham, Milton, and Brookline. Compared to the rest of the country, though, Massachusetts healthiest housing markets aren’t exactly impressive. Even our best markets require a bigger chunk of a buyer’s income than the national average, which is about 20 percent. The town of Edgewood, Ky., earned a perfect 100 healthy market index, and Mesquite, Texas, came in not too far behind with a 99.6. Both towns demand around 18 percent of a buyer’s income. Sigh.
You can check out the full Massachusetts list below, and read about SmartAsset’s analysis here.
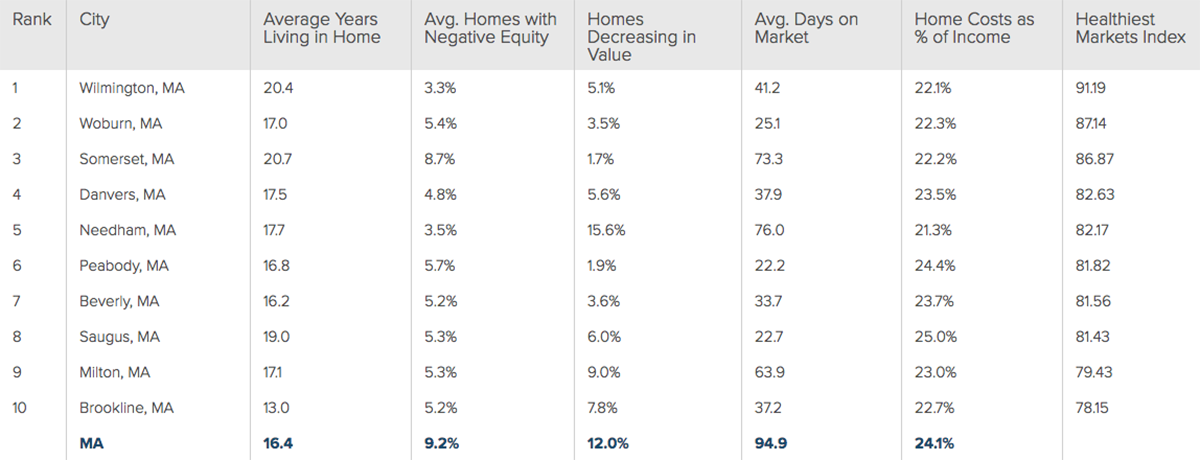
To see larger, click here.