Visualizing Cambridge’s Bike-Crash Data
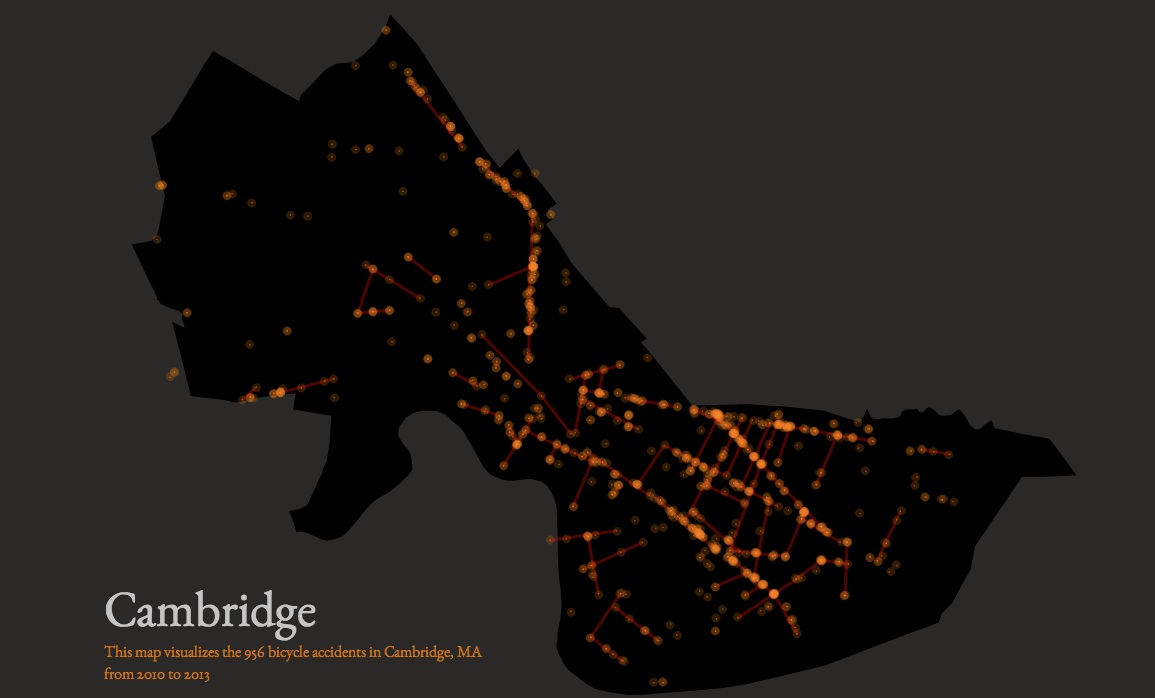
Image Via “You Are Here”
As winter makes way for spring, Hubway stations reopen, and biking season pedals into full-force, it’s important for cyclists to be informed about which streets are safest to travel on, and which ones to avoid. And that’s exactly what a group of students from the MIT Media Lab have set out to do.
Every day for the next year, the Social Computing Group at the lab will be aggregating thousands of micro-stories through data collection so they can help tell city-specific narratives about the human experience.
The project, called “You Are Here,” creates an atlas of community happenings by visualizing interactive heatmaps to tell people’s stories on a global level. To kick off the project, they’ve started with just six maps, one of which contains datasets revealing where bike crashes have frequently happened—and have been reported—not far from the lab in Cambridge.
Using data collected from the Cambridge Police Department, the interactive map used to tell the story of the city’s bike crashes allows users to scroll over each designated orange spot and view the exact street name where a reported accident occurred. The map, which portrays the 956 bicycle accidents in Cambridge from 2010 to 2013, also uses red lines to connect certain data points, and help people visualize the streets where accidents are most common (many occur on Massachusetts Avenue and Cambridge and Hampshire Streets).
“The purpose is to make the invisible, visible in a way that makes it clear to people how to improve their city,” said Sep Kamvar, one of the creators of the project.
Beyond mapping out where accidents have happened, “You Are Here” digs deeper by breaking down the accident information into subsets. They do this by providing graphs that show each one of the streets with the highest number of accidents. The information is then broken down from the most-to -least amount of crashes, and breaks out the roads where the reported collisions took place so they can be viewed individually. There is also an option for a Google street view of each accident site when a person clicks on a specific data point.
The group hopes that by mapping the data in this way, they can alert both riders and municipalities about problem sections in the city so fixes can be implemented to make the roads safer. “I certainly hope that each map helps as a tool for cities to prioritize what to do next. If they are planning on making separated bike lanes, this gives of a sense of where these should go,” said Kamvar.
According to the group, to get this information together, the data extraction and geolocation was created using Python, and the visualization aspect of the project was written in JavaScript and D3. The group then used the Google Maps API to geolocate every crash point, since the data was given to them as street addresses or intersections.
The Cambridge map is part of a bigger project for the team behind “You Are Here,” though. Kamvar said they’ll make a similar map to the one they’ve compiled for Cambridge “every day for the next year” so they can continue to tell tales from around the world, covering all of the “little things that make up human life.” The group plans on rolling out at least 100 maps for 100 different cities to share these stories.
Besides the Cambridge bike data, the Social Computing Group made a map of the locations of every independent coffee shop in Cambridge and the walkingshed community associated with it. The map uses colorful dotted patterns to show where the shops are, and then links out to each store’s website when a user clicks on a location.
Kamvar said a new map will be posted daily, but the group has some all ready to launch as they continue to work on new ones. “We will map things from street trees to property values to where there are rats,” Kamvar said. “Each map will have a visualization that feels appropriate to the datasets.”
As for other cities, the group has compiled bike-crash data for Portland, Oregon, San Francisco, Los Angeles, and Chicago.