The Storm Is Coming
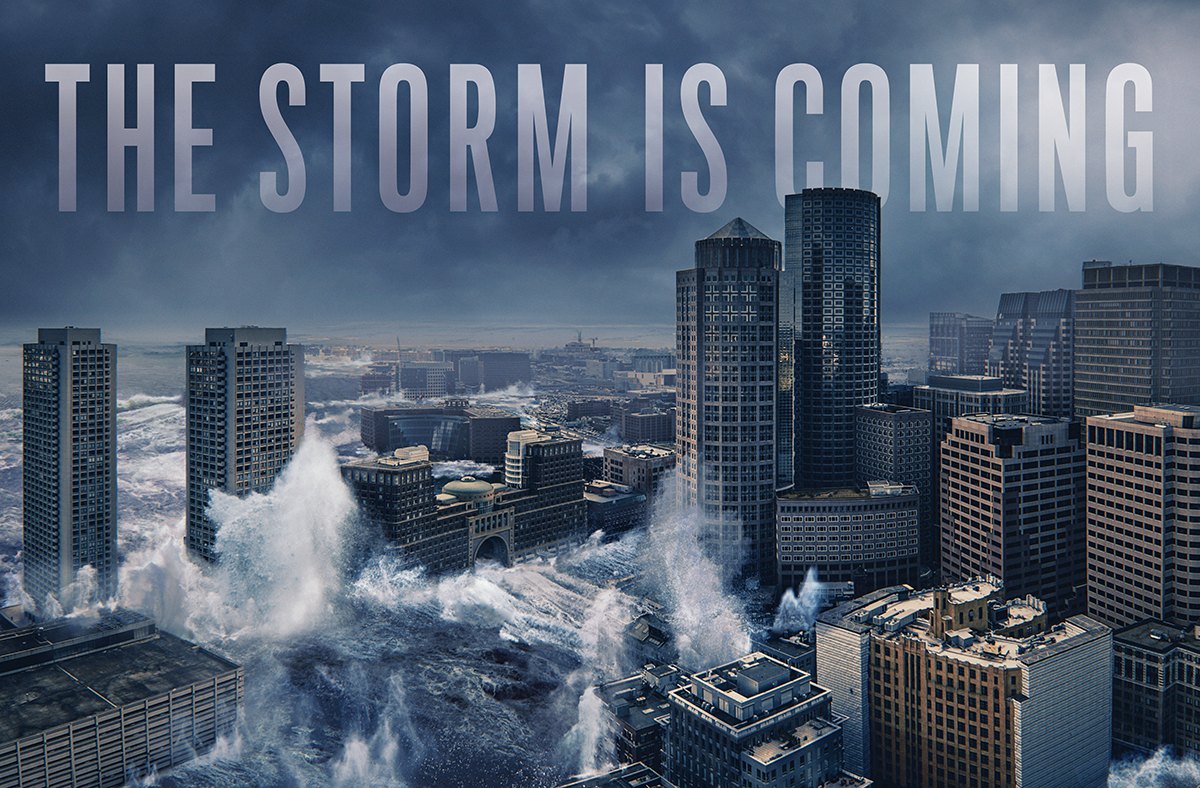
Atlantic Avenue and the Seaport District could resemble this dramatic rendering one day if we don’t start preparing now. / Illustrations by Peter Crowther
The water came slowly at first, just a dark film sliding over the seawall. Half an hour later, it was 10 inches higher. Miniature waves from the Atlantic pulsed over the sidewalk, passed under benches, and jumped the curb, soaking the grass on the other side. Another hour, and the water was 2 feet higher. The pulses turned into violent overland surf. From Manhattan’s Battery Park—and other points along the coast—the water spread inland, filling city streets, crashing through storefront windows, and pouring into basements. This was New York on October 29, 2012, the night Superstorm Sandy slammed into the city.
Beginning as a mutant storm when a hurricane collided with a nor’easter and formed a hybrid more powerful than either alone, Sandy was pushing the ocean onto the shore. This kind of event is called a storm surge. Caused by breakneck winds and low air pressure, it makes the ocean temporarily rise to exceptionally high levels.
As the water continued to rise—another foot and a half over the next 90 minutes—it poured down subway stairwells and overpowered makeshift plywood dams. Inside the subway’s uptown control center, screens monitoring movement on the rails had been blank for hours. Now they flickered to life as water raced over the tracks.
Meanwhile, half of Manhattan was dark: The utility company partially shut down the grid before the storm hit, and the water took care of the rest, flooding nearly every electric facility operating downtown. In spectacular fashion, a generator at the East 13th Street substation shorted out, creating a high-voltage arc that lit up the sky and produced an ear-shattering boom that shook buildings for blocks in every direction.
As bad as it was, the destruction in Manhattan—nestled in the apex of New York Harbor—was only the half of it. Farther out, the water hit with even more force. In Breezy Point, a seaside community in Queens, 10-foot waves rolled off the open ocean and flooded the entire peninsula. Then came the fires. Sparked by contact between saltwater and live wires, flames engulfed more than 120 houses in mere hours. Meanwhile, the storm surge pulled off feats of impossible strength typically reserved for Hollywood special effects: It swept away cars, dropped a fishing yacht on top of a seafood restaurant, and piled up sailboats like a stack of children’s bath toys. It also killed—drowning, crushing, and sweeping people away.
By the time the water level peaked, the tide was 9 feet higher than usual. The storm surge had claimed 43 lives, destroyed thousands of homes, crippled New York’s public transit system, and cut off power to two million residents. The damage would cost at least $70 billion to fix.
Lastly, the storm set off a panic in local governments up and down the East Coast. New York was caught unprepared, but it wasn’t alone in its failure to brace for the inevitability of an extreme flood. From Atlanta to Portland, few cities were ready for an assault like Sandy. Now, four years later, scientists and city officials are still asking the same white-knuckled question: Are we ready for when it happens here?
For Julie Wormser, Sandy hit at just the right time. As the executive director of the Boston Harbor Association, her job was to make Boston wake up to the reality of flood risks. Sandy, she believed, was going to make her work easier.
When New York flooded, Wormser was finishing her report about the risks Boston faces due to sea-level rise and storm surges. It was a valuable resource, she knew, but would anybody read it?
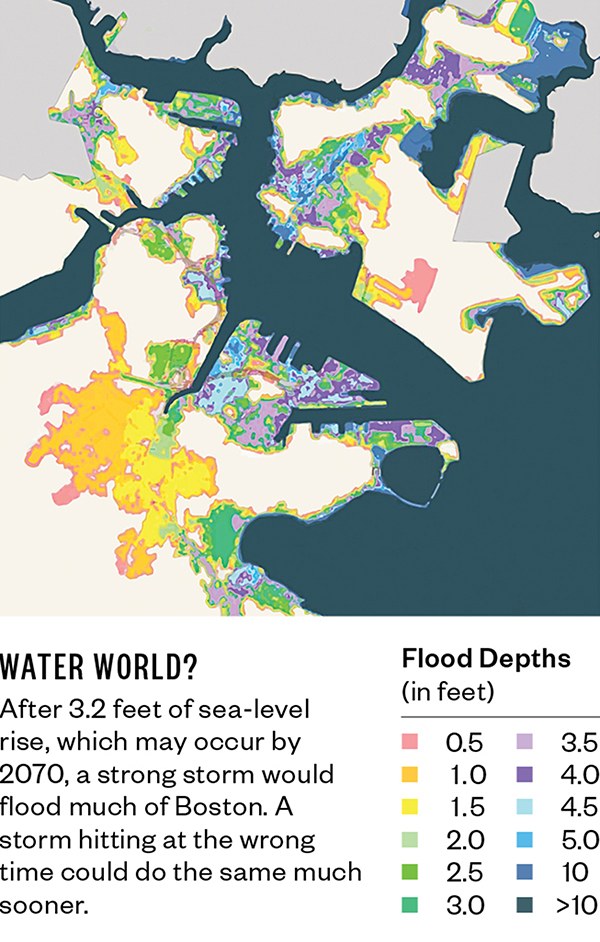
History wasn’t exactly on her side. Two years earlier, the BHA had released maps showing how much of Boston might flood in a huge storm. The most extreme map illustrated a worst-case scenario, and it looked terrible. Showing different flood depths color-coded in yellow, pink, orange, and dark blue, the map looked as if cans of neon paint had been spilled all over it. Fort Point and the Seaport were covered in pink (meaning flood depths of 2 to 4 feet) with a few blotches of dark blue (flooding greater than 6 feet). Parts of the downtown waterfront were orange (4 to 6 feet). Charlestown, East Boston, and Logan Airport were pink, yellow (up to 2 feet), and orange. The streets of the Back Bay were multicolored canals. The map also showed flooding in surrounding communities: Somerville, Everett, Chelsea, and Quincy.
In the years leading up to Sandy, the BHA had showed its flood maps to anyone who would pay attention. Ellen Douglas, a scientist at UMass Boston who helped create the maps, was disappointed they didn’t have the desired effect: “We went to one meeting at the BRA”—the Boston Redevelopment Authority, the city agency that oversees planning and new real estate development—“and we were accused of going around scaring people.”
After Sandy, things began to change. Officials at virtually every city and state agency I’ve spoken to—including the BRA—talk about New York’s storm as a come-to-Jesus moment. Suddenly, the scenarios in the BHA’s maps no longer seemed like abstractions, and it was easier for government officials to see the multicolored stains as proxies for destruction rather than the results of a useless academic exercise.
Wormser—who today serves as VP for policy at the advocacy group Boston Harbor Now—admits that Boston is lucky in some ways. Our harbor faces east, so hurricanes, which come from the south, are unlikely to hit us with their full force. The harbor also comes with protective features. The harbor islands serve as Boston’s offensive line, slowing down rushing water and knocking down towering waves.
But other factors conspire against us, particularly our low-lying land, which sits on dirt that was dumped into former tidal flats. When Boston was founded in 1630, it practically looked like an archipelago. The area comprising Beacon Hill, Downtown Crossing, and the North End was virtually an island, connected to Roxbury only by a narrow land bridge. Modern-day Congress Street, on the inland side of Faneuil Hall, was the coast. South Boston was a peninsula pointing east. The Back Bay was a bay.
Boston’s modern shape—an amoeba with appendages jutting into the surrounding bodies of water—is the result of the city’s first public works project. Soon after settling here, Bostonians began turning water just beyond the coast into land. They began by filling in marshes with trash and mud. In the 19th century, the project accelerated: Thousands of men with shovels and horse-drawn carts created the land where the South End, Chinatown, and the downtown waterfront now sit. After the city burned in the Great Fire of 1872, the rubble from destroyed buildings became the land underneath parts of South Boston. Surrounding the new land were stone seawalls that kept the dirt and gravel in—and the water out. Expanding the city took more than three centuries, but finally, by the 1950s, Boston looked more or less as it does today.
The consequence is that nearly 20 percent of Boston’s land is fill. For a while, this was just a bit of trivia. Now this fact has greater significance. Thankfully, Boston’s early city planners were prudent: They built the seawalls high enough to keep water out even during the highest tides of the year. The problem is that all of their planning was based on one unexamined assumption: that the ocean would stay put.
Source: MassDOT-FHWA Pilot Project Report: Climate Change and Extreme Weather Vulnerability Assessments And Adaptation Options for the Central Artery, June 2015
Today, we know that the ocean isn’t holding up its end of the bargain. Between 1900 and 1950 the seas rose slowly, likely only a few inches in Boston. But the rate has been accelerating ever since. In the second half of the last century, sea levels increased another 4 to 6 inches, and the trends are getting worse. On average, sea levels rise each year more than the year before. Climate scientists can’t say exactly how much they will rise in the future, but what we do know is that in the decades to come, sea-level rise won’t be measured in inches, but in feet.
How many feet will depend on a combination of luck and pollution. Greenhouse gases—such as the CO2 emitted from cars and the methane expelled by cows—cause the atmosphere to trap more heat, which warms the water beneath it. Warm water takes up more space than cool water. So as the oceans get hotter, they also get higher. Warmer air also melts ice, meaning giant frozen sheets on Antarctica and Greenland dissolve into the ocean, as if into a bathtub, and fill it up.
The causes of sea-level rise are simple in principle, but hard to model precisely. As a result, the projected ranges are wide. Uncertainty about future emissions clouds the picture even further. If the global community reduces emissions moderately, Boston Harbor is likely to rise 2.5 to 5 feet by 2100. If countries do nothing, the harbor likely will rise between 3 and 7 feet.
Every foot of sea-level rise significantly increases the chances of flooding. Today, a 5-foot storm surge produced by an unusually strong hurricane or nor’easter could flood parts of Charlestown, East Boston, the downtown waterfront, and the Seaport. But, as sea levels rise, it will require a less severe storm surge to produce a similar level of flooding. After 2 feet of sea-level rise, it might take only a 3-foot storm surge to produce something like today’s 5-foot flood. And, unlike 5-foot storm surges, 3-foot ones are pretty common, occurring several times per decade. After 5 feet of sea-level rise, which could occur by the end of the century, a 5-foot flood will occur with every high tide.
All of this boils down to a sobering assessment of Boston’s future: What would be a rare disaster today will become a once-in-a-decade event within a generation and a twice-daily occurrence by the end of the century.