This Fall Foliage Map Is the Best Way to Track the Leaves This Season
Don’t panic, but summer is almost over. While we’ll all sad to leave behind the beach days, Shark Week, and eating clam strips al fresco, that means we’ll soon be treated to the most New England of all the seasons: the crisp and colorful fall.
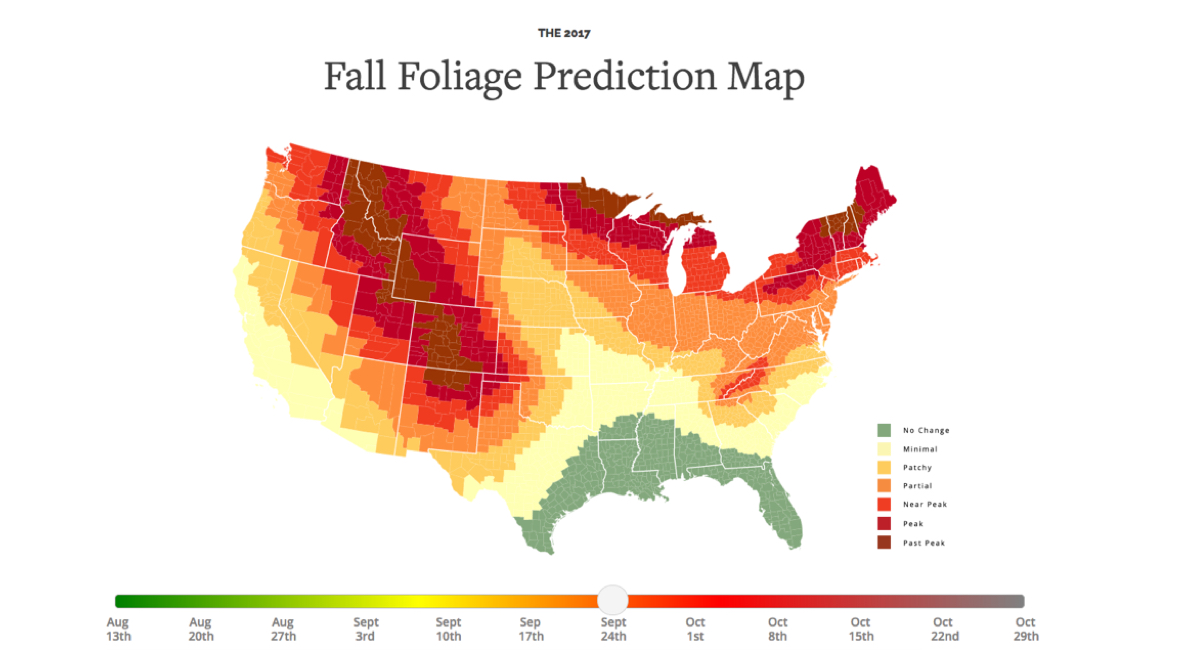
Trying to chase the end-of-summer blues away, and want to make the most of the foliage this year? You’re in luck. There’s a perfect interactive, data-driven tool you can use to track the progress of the leaf-changing and plan your autumn trips to scenic destinations, courtesy of the National Oceanic and Atmospheric Administration and SmokyMountains.com. The site, which promotes tourism to the Smoky Mountains region (hat-tip to our leaf-loving comrades down south), used data points from NOAA to put together what it says is as accurate as possible a map of what we can expect in the coming months.
Its creators used “hundreds of thousands of unique data points” to make its predictions, data scientist Wes Melton tells Travel & Leisure.
Due to warmer temperatures and higher-than-usual precipitation, that data is telling researchers to expect the leaves to turn a little earlier than usual and for the colors to last a little longer. Yankee Magazine’s 2017 foliage forecast—which uses some algorithm that takes into account the amount of snowfall this past winter, the drought conditions we experienced, the rain, the prevalence of warm and sunny days, the invasion of gypsy moths, and other factors—says “strong and vibrant color” is in our future. For that analysis, you can thank foliage reporter Jim Salge. Jim, thank you.
That’s all good news if you’re like most people and can’t help but get excited by all those autumn hues this time of year.
Who needs summer, anyway?