New Bike Crash Map Offers Comprehensive Look at Where and How Accidents Happen
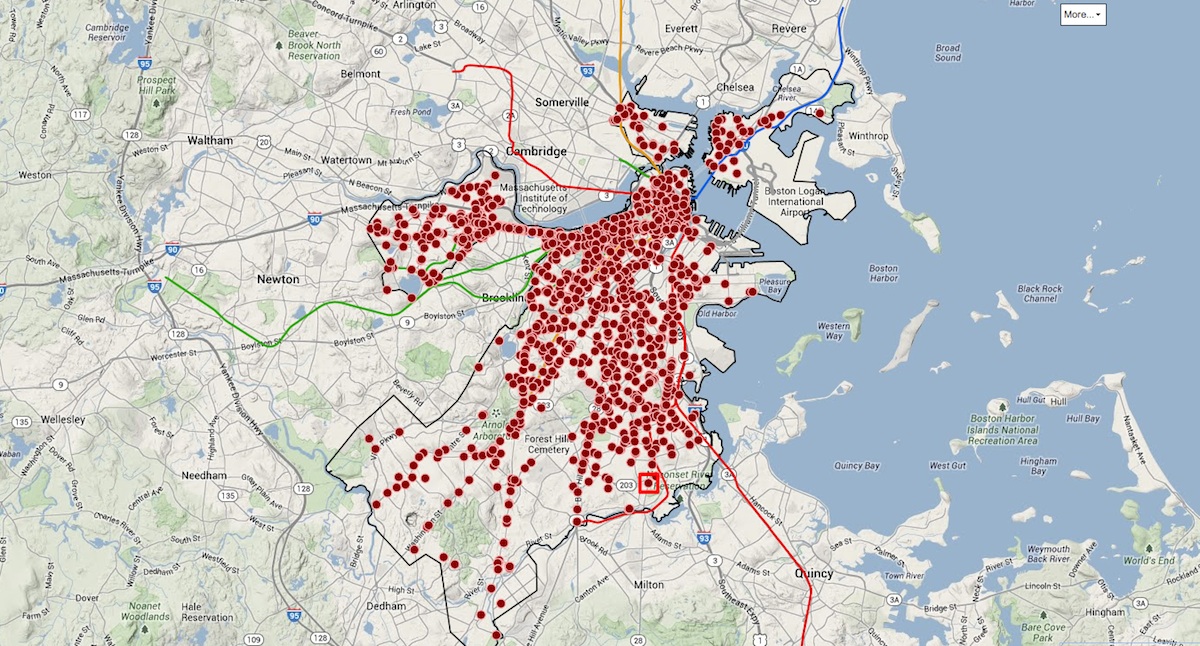
Image via Boston Area Research Initiative
A new map released this week by a collaboration of advocacy groups and researchers breaks down in great detail each and every reported bike accident that occurred in Boston over the last four years, including what the weather was like on the day that the incident happened.
“This is a cutting-edge database. There are very few cities, if any, where this comprehensive data is available for bike safety and collision reports,” said Dan O’Brien, research director at the Boston Area Research Initiative. “This information is not always that accessible, and not always that interpretable. I hope the public runs with it in some way, and they really use it.”
The interactive map, which is supplemented by accessible raw data with more in depth descriptions about each bike accident, pinpoints every crash reported to police and emergency responders between 2009 and 2012. By hovering over the dots on the map, users can then glean information about the time the accident happened, what street it was on, what day it occurred, the age and race of the cyclist, and the weather.
“What we put on the map is a navigable, bite-sized version about the accidents,” said O’Brien. “The raw data has information about whether someone ran a red light, if alcohol was involved, if they had a helmet on, if a car door was involved—all derived from the narratives of police reports.”
The raw data and map are a product of a BARI fellowship completed by Dahianna Lopez, a doctoral student from Harvard’s Injury Control Research Center. Lopez and BARI partnered with the Boston Police Department, the Boston Cyclists Union, and Mayor Marty Walsh’s office to create and make public the detailed information.
The project was an extension of the Boston Cyclist Safety Report, which was released by the city in the spring of 2013.
O’Brien said since that report was released, the research institute has been working on taking that same internal data and reexamining it so that it didn’t contain any identifying information about each bike crash. Researchers plucked people’s names from the police reports that contained collision narratives, and then plugged the reports into the system to create the map.
He said the map and raw data provides bike enthusiast and advocacy groups with an opportunity to identify the “hotspots” where accidents are frequent, and put a microscope on why they might be occurring in that area.
Broken down into two categories, the map shows each crash in Boston, and also groups crashes together into clusters to provide insight into which areas need vast and immediate improvements. “You can sort of get a snapshot of what’s happening by looking at these clusters,” said O’Brien, referencing one particular area on the map, near Longwood Medical Center, that Lopez identified.
According to the data, in that spot bikers frequently had problems when encountering a portion of the MBTA’s Green Line tracks. He said there were multiple reports of solo crashes. “The way the Green Line runs in the road is treacherous and people keep getting caught in the tracks there. I think people who are biking themselves can use this data to sort of learn about the geography of bike safety in the city, and ways it needs to be improved,” said O’Brien.
Pete Stidman, executive director of the Boston Cyclists Union, a driving force behind making this data available to the public in a way that can be easily digested and examined, said the raw data is “the most comprehensive” information he has seen to date. “I think it’s a big step,” he said. “We now have a really good resource that indicates to some degree the cause of the crashes we are seeing.”