A ‘Twist’ on the MBTA’s Map Design
Used with permission
For Dr. Maxwell Roberts, cartography is more than just a hobby. It’s the convergence of his interest in design and his career as a psychologist.
“I’ve done a lot of research into how people make inferences, and intelligence testing. I began to wonder how my intuitive responses to maps designed in different ways was related to my knowledge of how people solve problems in general,” he said.
By studying their history and layout, the University of Essex professor has been reconfiguring transit maps of subway systems all around the world, creating new conceptual blueprints that in some instances offer more clarity than the traditional versions, for more than a decade.
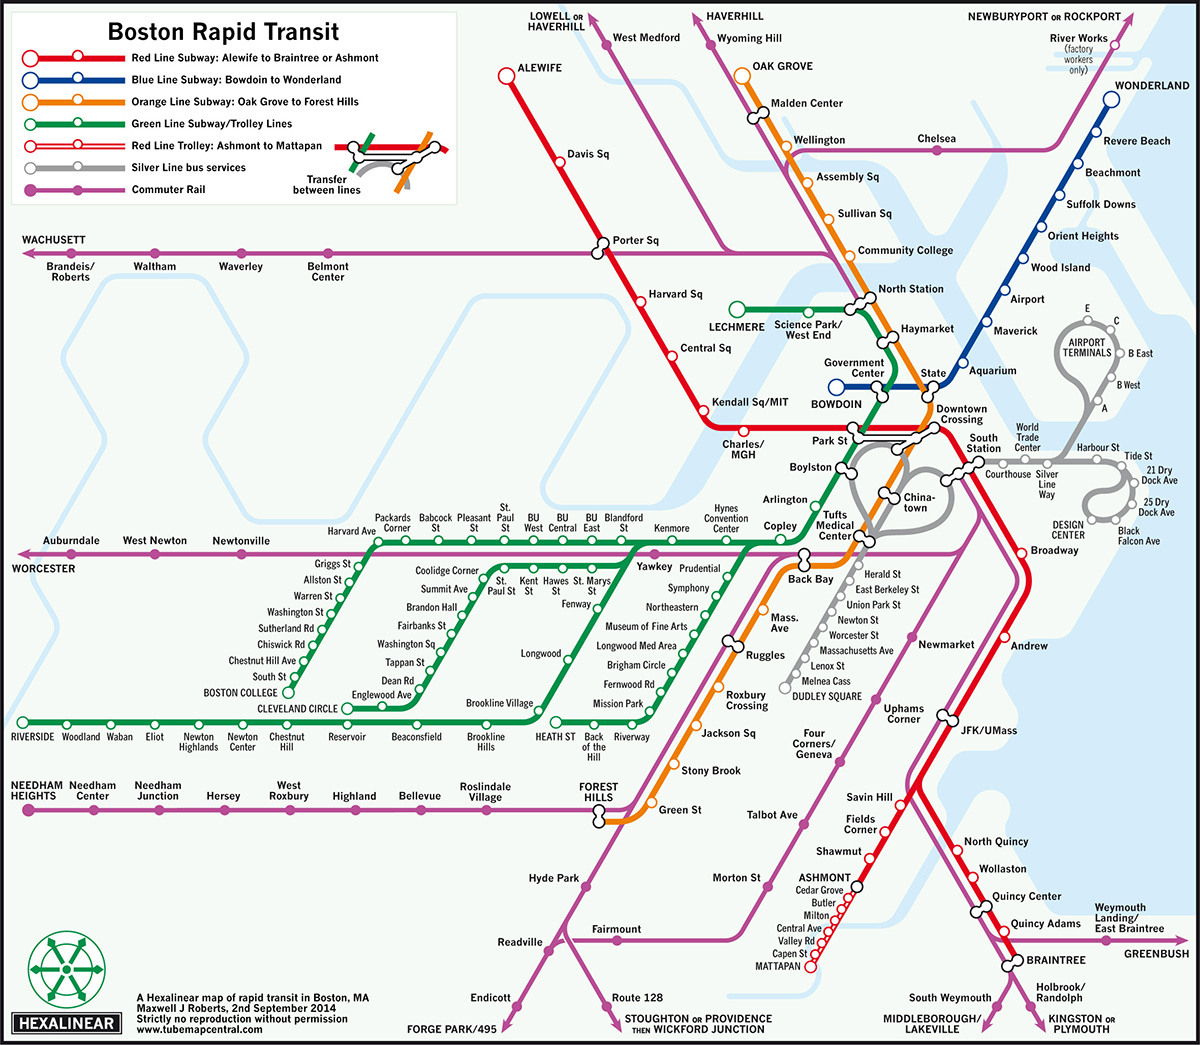
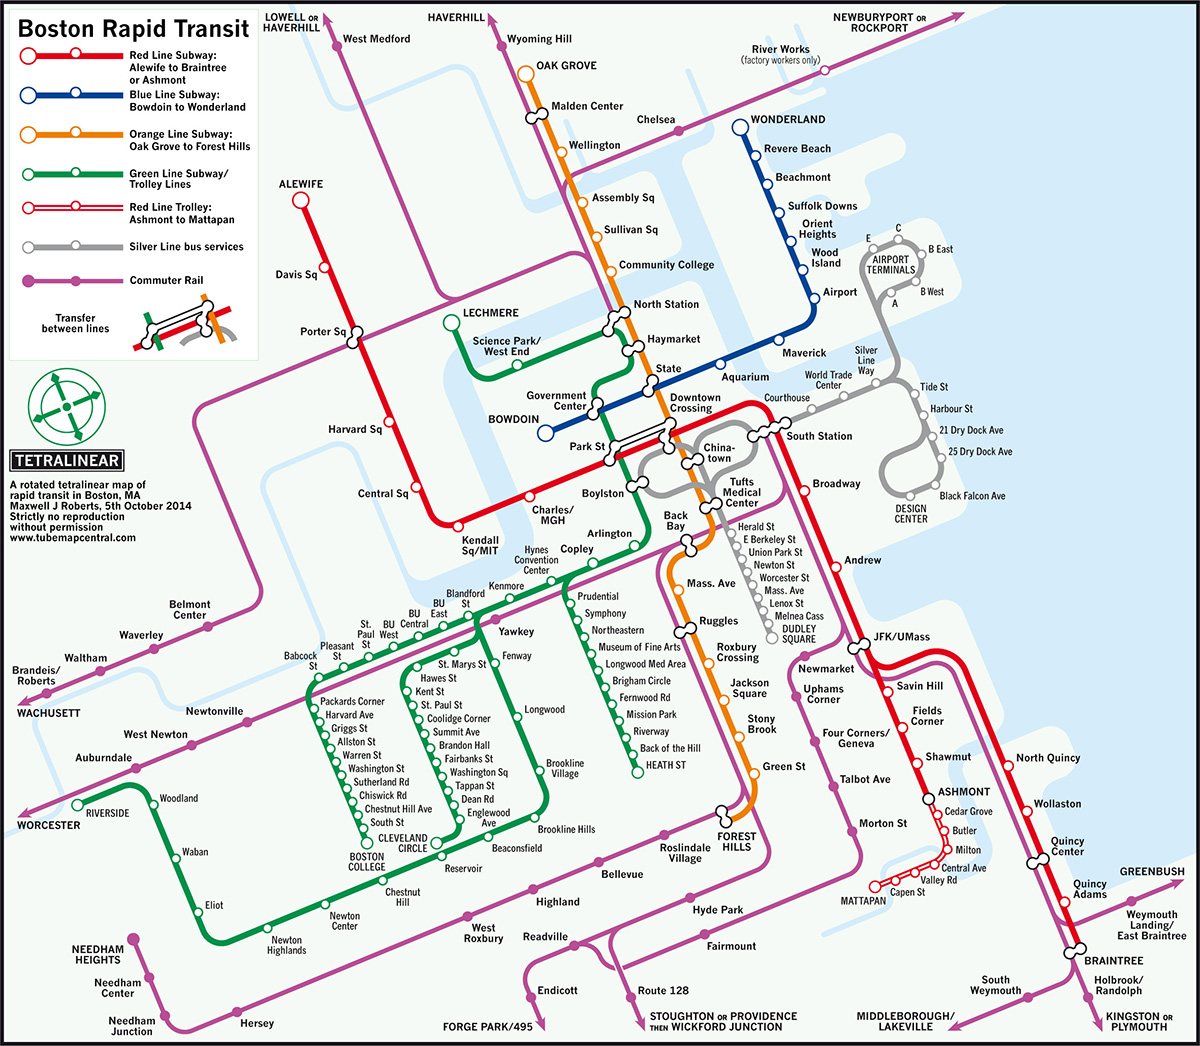
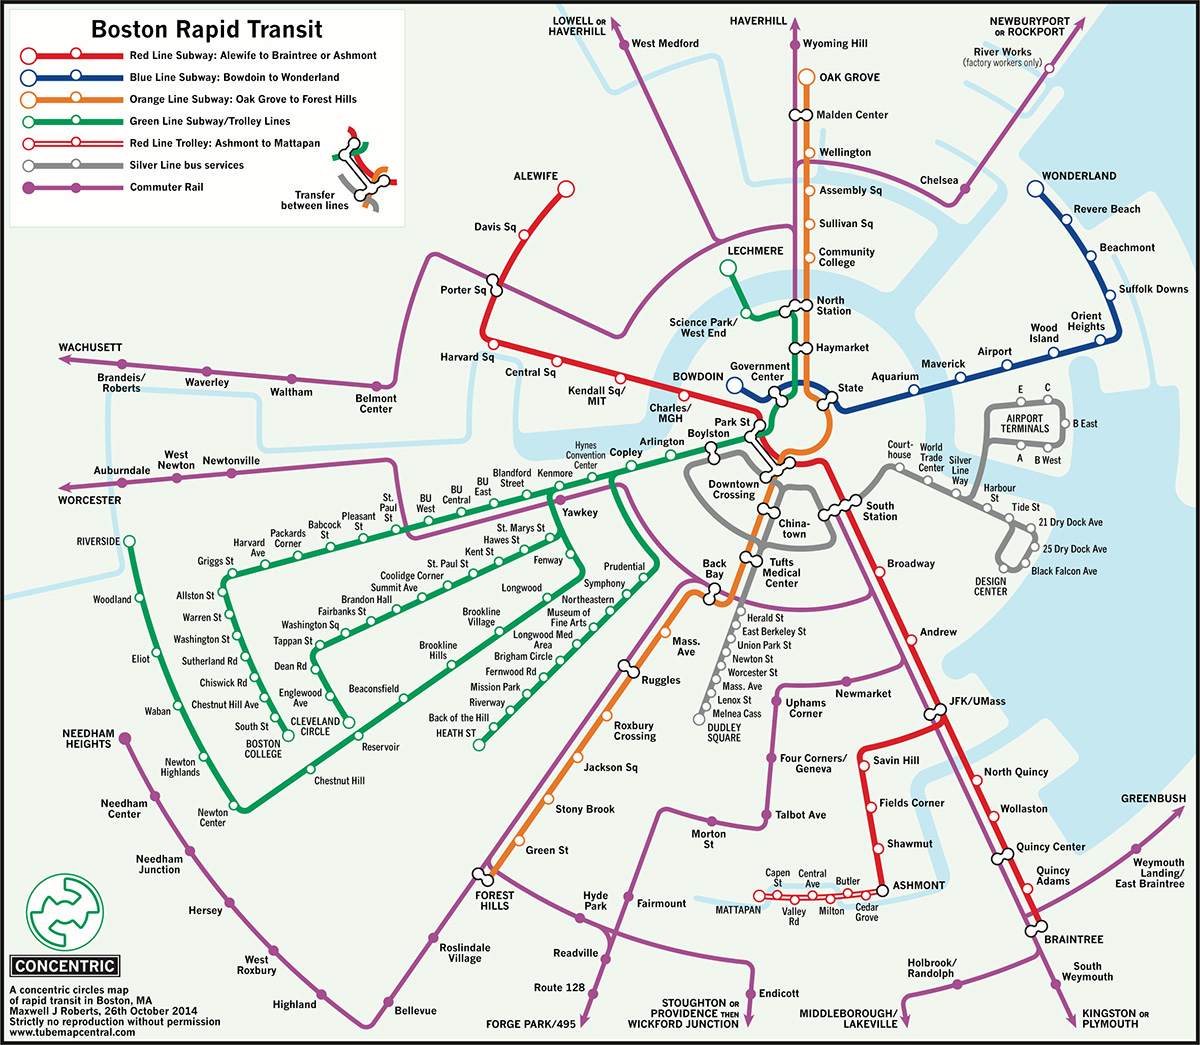
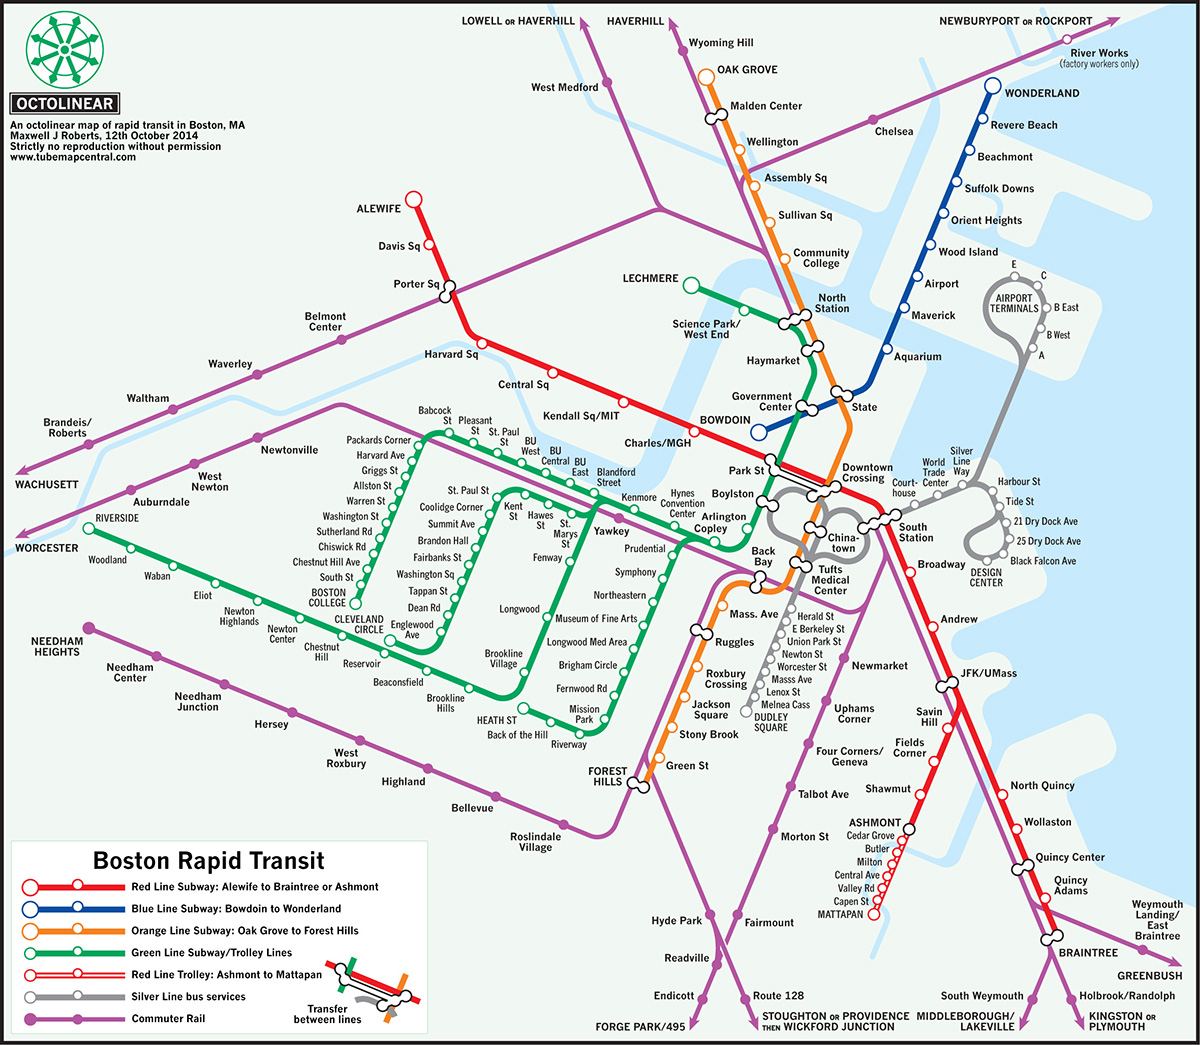
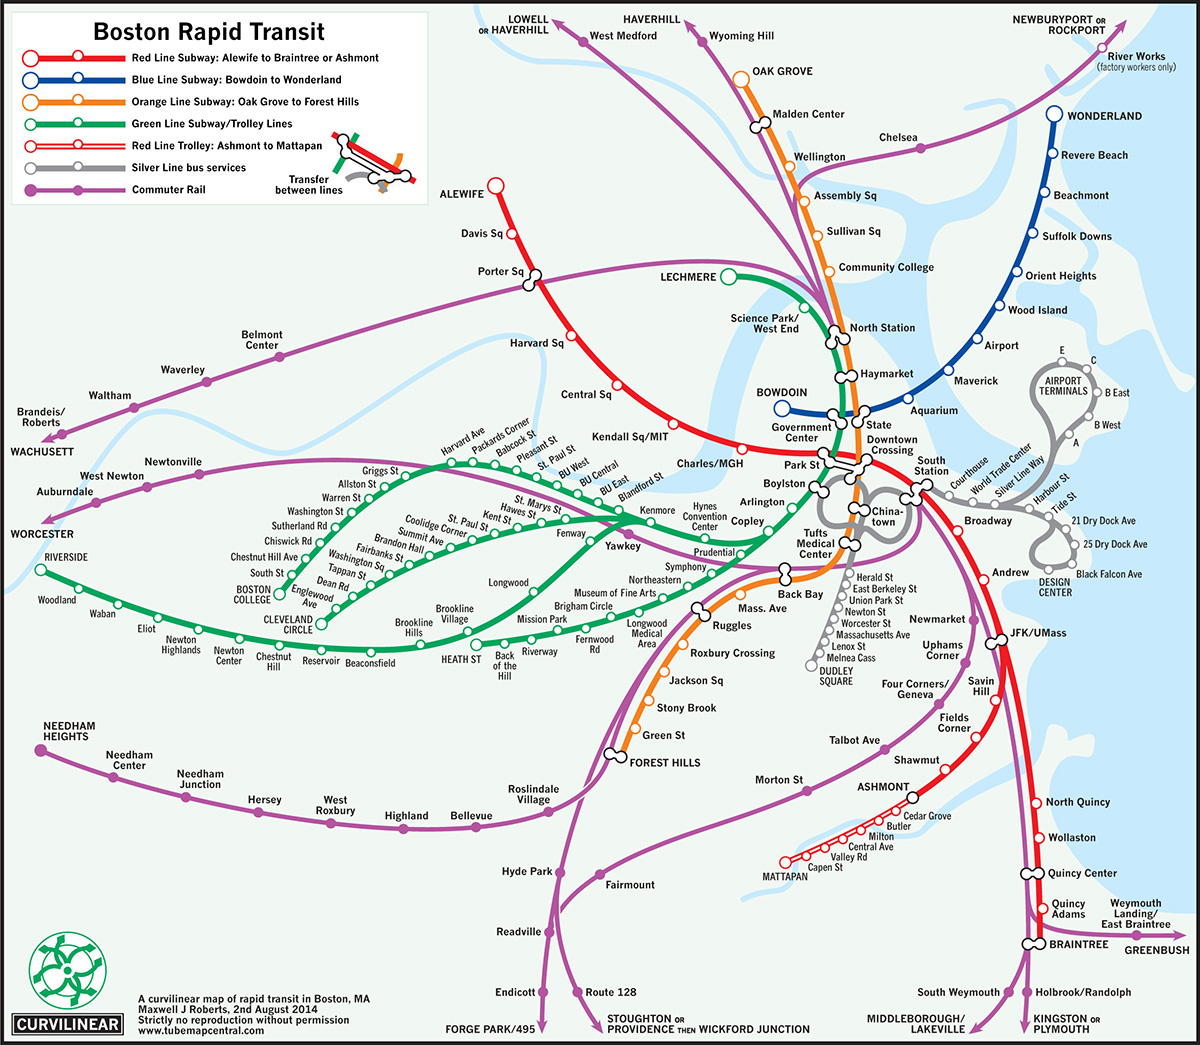
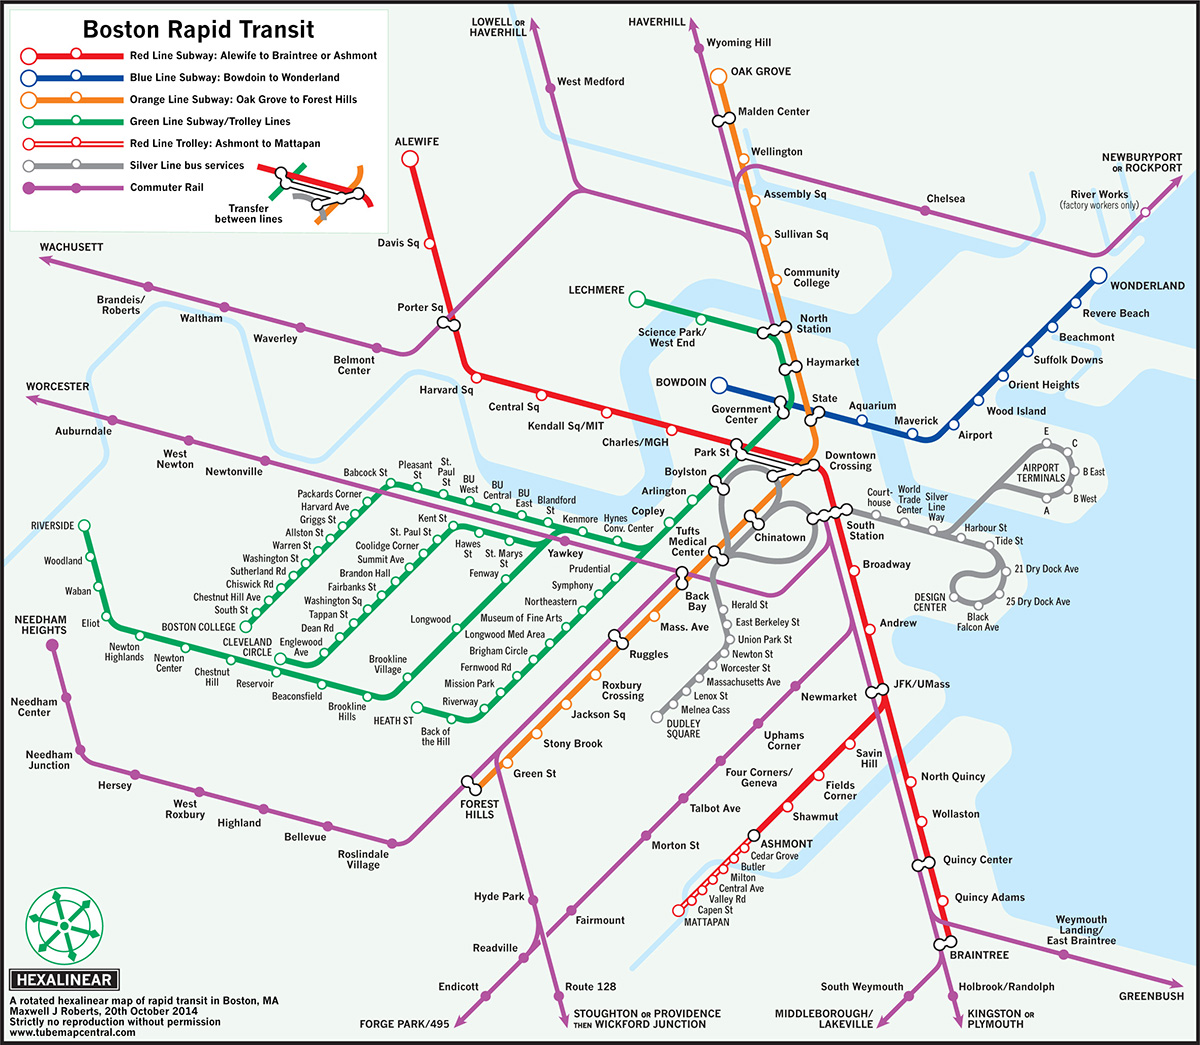
His most recent obsession has been contorting Boston’s MBTA map by applying a set of principles based on topography, precise angular structure, and coherence. After seeing the result of the MBTA’s recent map redesign contest, Roberts used his methodology and design process to construct his own unofficial maps. The result is a series of diagrammatic representations that transform the T’s model into a concentric circle, and tetralinear and octolinear shapes.
Roberts has presented nine Boston designs so far, but there are 13 completed, with several more to come. Seven of them are detailed here. With all of the time spent examining the T’s network, he said it’s finally time to move on to other projects.
We talked with Roberts about his latest undertaking to find out what made working on the lines that connect Boston’s city points different from the other maps he’s completed. Here’s what he had to say:
Where’d you get your map-making skills?
I’ve been researching transit map history and design for over 10 years now. I create my own designs and submit them to usability tests, in which I ask people to locate stations and plan journeys.
Tell us about the design process.
I am trying to evolve a framework for effective design based on the following criteria: simplicity, coherence, harmony, [aesthetics], balance, and [topography].
Within this framework, every city is different, and what works well in one case might not work for another. The traditional London Henry Beck design rules of horizontal, vertical, and 45-degree diagonals is a good example. These angles do not work well for Paris, where simple line trajectories are impossible. As long as the five criteria above are satisfied, the design rules don’t really matter. [There’s] nothing magic about the way that London does it.
With all the different subway maps around the world, what drew you to Boston’s?
I’ve designed a number of maps for New York, and while it is clear that a lot of people there yearn for something more organized than the current official NYC Subway map, a sizable chunk of people get really, really upset at the idea of any geographic distortion at all. Then I [learned] about the Boston Subway map competition, and I was astonished at the winner, one of the most geographically distorting transit maps in the USA.
Why are New Yorkers so sensitive to distortion, and Bostonians apparently indifferent? So, I decided to take a look at the Boston network, and see whether I could create something with nice simple line trajectories, good shape, all the Green Line stops, and less distortion.
What other differences were there between working on Boston’s transit map compared with New York’s?
The coast and rivers need a lot of work to simplify them and yet keep them looking convincing. That part of the design takes almost as long as configuring the lines. The [Silver Line] loops need a lot of thought so that they make intuitive sense. Unusually, the city doesn’t really need horizontal or vertical lines—slight tilts result in something that is much more comfortable and not particularly geographically distorting.
I also found the Boston concentric circles map a real struggle; the network fought me all the way on that one. The New York circles design was quicker for me to create even though the system is more complicated. Every network is different, and needs different design rules to show it off at its best.
You’ve made a few versions of the MBTA map. Did you like working with this transit map in particular?
The answer is yes, if you choose the right design rules. The multiple maps are part of my process. This is a relatively simple network, but there are quite a few challenges and decisions to make. All those Green Line stops, getting the center legible and compact—if the center is too expanded, it can become diffused and indistinct, so that this key destination loses definition. I learned a few things from doing this, and I’ve mapped the city in ways I’ve never attempted before. I definitely enjoyed this more than my Washington, D.C., and Chicago attempts. I am taking a rest at the moment, but there are more to follow.
What’s your methodology for creating these intricate designs?
My methodology is to create design sequences; to understand the difficulties of mapping a network and finding the best way to do it by running through a large combination of design rules, two-angle maps, three-angle maps, four-angle maps and so on, up to linear maps with any angles you like, and curvilinear maps, based on Béziers and concentric circles. If you don’t try to exhaustively explore a city like this, I don’t think you can really say that you understand how a network fits together, what its key challenges are, and how best to address them.
Any favorites?
My own favorites? Tough choice. I have 13 to choose from so far! The curvy map really suits the system well, and the curves are simple and elegant, but a lot of people believe—incorrectly— that curvy maps have poor usability. For the linear maps, this one on a rotated hexagonal grid came together nicely. Of course, I expect people to disagree, but that’s the advantage of my approach, everyone will have something that they like.